Exercises: Fit a Function to Data
Work through each section in order. When choosing a model family, justify
from BOTH the scatter plot's form and the context's mechanism. When using a
fitted function, substitute or solve carefully and state every answer with
units. Remember: a fitted model captures the overall trend — it need not pass
through every point — and predictions far outside the data range
(extrapolation) are not as trustworthy as predictions inside it.
Warm-Up: Function Families and Evaluation
These problems review skills you already have from Algebra 1.
A regression on real data produces the equation , and it tracks the scatter plot's trend closely. Which statement best describes what this fitted function is?
Which function family produces a graph that rises to a turning point and then falls (a U-shape or upside-down U)?
Fluency Practice: Choosing the Model Family
For each scatter plot, decide which model family fits its form.
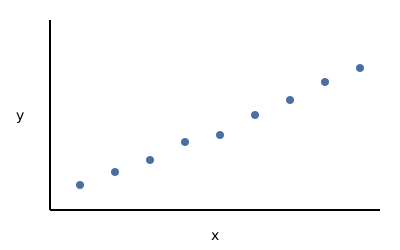
The scatter plot below shows data that increases by roughly the same amount for each equal step in — the points fall close to a straight line. Which model family best fits this data?
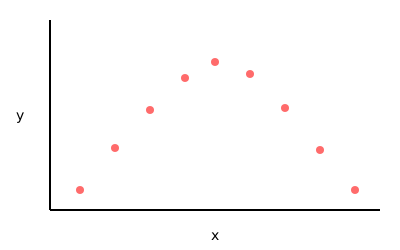
The scatter plot below shows a ball's height versus time after a throw: the points rise to a peak and then fall back down. Which model family best fits this data?
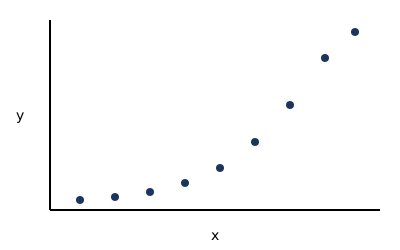
The scatter plot below shows a bacteria count versus hours: the points stay low at first, then curve steeply upward, roughly multiplying each hour. Which model family best fits this data?
A bacteria population is modeled by the exponential function , where is the number of hours and is the count. Predict the count after hours.
You're viewing 2 of 6 sections.
Create a free account to continue the full exercise set and save your progress.
Create free accountAnswer all problems to submit.