Back to Fit a function to data — Problem 2 · Task Set 6
Exercises: Fit a Function to Data
Work through each section in order. When choosing a model family, justify
from BOTH the scatter plot's form and the context's mechanism. When using a
fitted function, substitute or solve carefully and state every answer with
units. Remember: a fitted model captures the overall trend — it need not pass
through every point — and predictions far outside the data range
(extrapolation) are not as trustworthy as predictions inside it.
Grade 10·23 problems·~35 min·Common Core Math - HS Statistics and Probability·standard·hss-id-b-6a
Work through problems with immediate feedback
A
Fluency Practice: Choosing the Model Family
For each scatter plot, decide which model family fits its form.
1.
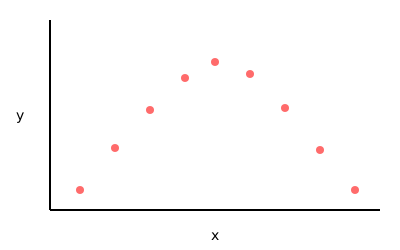
The scatter plot below shows a ball's height versus time after a throw: the points rise to a peak and then fall back down. Which model family best fits this data?