Back to Fit a function to data — Problem 1 · Task Set 6
Exercises: Fit a Function to Data
Work through each section in order. When choosing a model family, justify
from BOTH the scatter plot's form and the context's mechanism. When using a
fitted function, substitute or solve carefully and state every answer with
units. Remember: a fitted model captures the overall trend — it need not pass
through every point — and predictions far outside the data range
(extrapolation) are not as trustworthy as predictions inside it.
Grade 10·23 problems·~35 min·Common Core Math - HS Statistics and Probability·standard·hss-id-b-6a
Work through problems with immediate feedback
A
Fluency Practice: Choosing the Model Family
For each scatter plot, decide which model family fits its form.
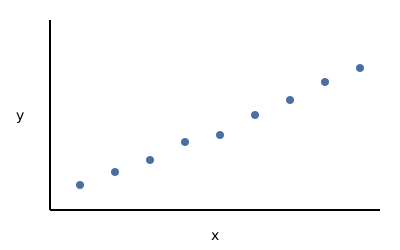
1.
The scatter plot below shows data that increases by roughly the same amount for each equal step in — the points fall close to a straight line. Which model family best fits this data?