Back to Fit a linear function to a scatter plot — Problem 2 · Task Set 8
Exercises: Fitting a Linear Function to a Scatter Plot
Work through each section in order. When a scatter plot is shown, first
decide whether it suggests a LINEAR association before fitting a line. To
find a line's equation, read two convenient points ON the line (not
necessarily data points), compute slope as rise over run, and find the
y-intercept. Remember: a line of fit balances points above and below and
need not pass through any data point.
Grade 9·22 problems·~35 min·Common Core Math - HS Statistics and Probability·standard·hss-id-b-6c
Work through problems with immediate feedback
A
Fluency Practice
Read scatter plots, judge form, and find or use line equations.
1.
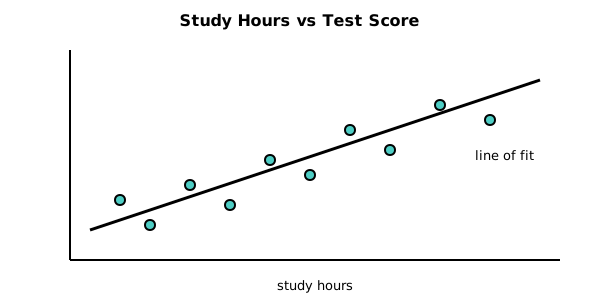
A scatter plot of study hours versus test score is shown with a line drawn through the cloud. The line passes through none of the plotted data points, yet roughly as many points sit above it as below. Is this a reasonable line of fit?