Exercises: Fitting a Linear Function to a Scatter Plot
Work through each section in order. When a scatter plot is shown, first
decide whether it suggests a LINEAR association before fitting a line. To
find a line's equation, read two convenient points ON the line (not
necessarily data points), compute slope as rise over run, and find the
y-intercept. Remember: a line of fit balances points above and below and
need not pass through any data point.
Warm-Up: Slope, Lines, and Form
These problems review slope and line basics you already know.
Fluency Practice
Read scatter plots, judge form, and find or use line equations.
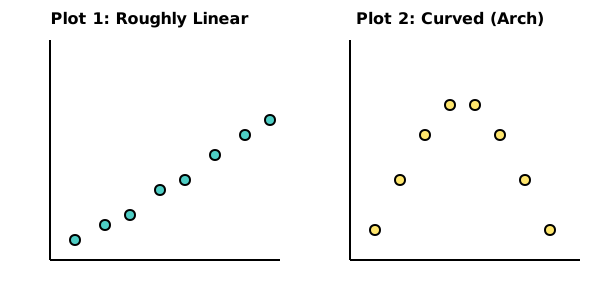
Two scatter plots are shown. Plot 1 shows points rising in a roughly straight band; Plot 2 shows points rising then falling in a clear arch. For which plot is fitting a linear function appropriate?
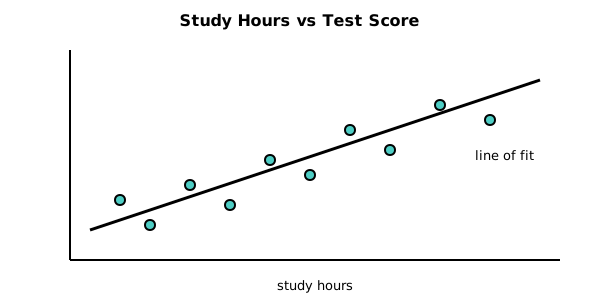
A scatter plot of study hours versus test score is shown with a line drawn through the cloud. The line passes through none of the plotted data points, yet roughly as many points sit above it as below. Is this a reasonable line of fit?
You're viewing 2 of 6 sections.
Create a free account to continue the full exercise set and save your progress.
Create free accountAnswer all problems to submit.