Back to Assess fit by analyzing residuals — Problem 4 · Task Set 7
Exercises: Assess Fit by Analyzing Residuals
Work through each section in order. A residual is observed minus
predicted: positive when the data point is ABOVE the model, negative
when below. Keep the sign. When reading a residual plot, remember the
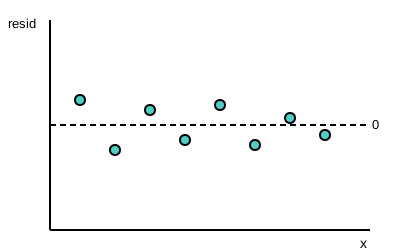
key idea: random scatter around zero means a GOOD fit, while a clear
pattern (a curve or a fan) means the model is wrong.
Grade 10·20 problems·~35 min·Common Core Math - HS Statistics and Probability·standard·hss-id-b-6b
Work through problems with immediate feedback
A
Fluency Practice
Compute residuals and read residual plots.
1.
The residual plot below shows residuals scattered randomly around the zero line with no clear pattern. What does this say about the fit of the model?