Exercises: Decide if a Model Is Consistent with Data Using Simulation
Work through each section in order. A "model" is an assumed chance
mechanism (for example, "this coin lands heads with probability 0.5").
To decide if data is consistent with a model, assume the model is true,
simulate the data-generating process many times, build the simulated
distribution, and see how often the model produces a result as extreme
as the one observed. Remember: a surprising result is EVIDENCE to
question a model, never proof the model is false; and an ordinary result
never proves a model true.
Warm-Up: Models, Chance, and Distributions
These problems review ideas you already know about chance and distributions.
A fair coin is one that lands heads with probability . You flip a fair coin 5 times and get 5 tails in a row. Which statement is true?
A free-throw shooter claims she makes of her shots. In one session she takes 20 shots. You want to simulate this session to see how many makes are typical. What should one trial of your simulation produce?
Fluency Practice
Apply the simulation framework: device, trial, statistic, repetitions, and reading distributions.
A model says a spinning coin lands heads with probability . Rank these results from LEAST surprising to MOST surprising under this model: getting 3 tails in a row, 5 tails in a row, 10 tails in a row.
A spinner model claims red comes up with probability . To simulate using a random-digit table (digits –), which assignment of digits correctly matches the model's probability for "red"?
A simulation has these design choices. The model is "a die is fair." We want to know if getting four 6's in 12 rolls is surprising. Fill in each design choice: the chance device that matches the model is a fair ̲ ̲ ̲ ̲ ̲ ̲ ̲ ̲ ̲ ̲ ̲ ̲ ̲ ̲ ̲ ̲ ̲ ̲ ̲ ̲ ̲ ̲ -sided die; one trial is ̲ ̲ ̲ ̲ ̲ ̲ ̲ ̲ ̲ ̲ ̲ ̲ ̲ ̲ ̲ ̲ ̲ ̲ ̲ ̲ ̲ ̲ simulated rolls; the statistic recorded is the number of ̲ ̲ ̲ ̲ ̲ ̲ ̲ ̲ ̲ ̲ ̲ ̲ ̲ ̲ ̲ ̲ ̲ ̲ ̲ ̲ ̲ ̲ in those rolls.
A simulated distribution of "number of heads in 10 flips of a fair coin" was built from 200 trials. The dot plot shows: most trials landed between 3 and 7 heads, the center is at 5, and exactly 2 of the 200 trials produced 9 or more heads. Estimate the fraction of trials that produced 9 or more heads (write as a decimal).
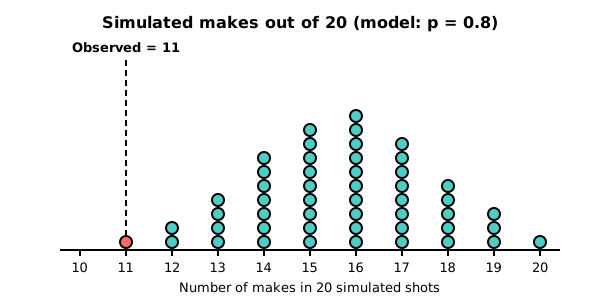
The dot plot below is a simulated distribution of the number of makes in 20 free throws under the model (50 simulated sessions). The shooter's actual session, 11 makes out of 20, is marked with the red dot far in the lower tail. Describe where the center of the distribution is, and explain in one sentence whether 11 makes looks typical or surprising under this model.
You're viewing 2 of 6 sections.
Create a free account to continue the full exercise set and save your progress.
Create free accountAnswer all problems to submit.