Exercises: Decide if a Model Is Consistent with Data Using Simulation
Work through each section in order. A "model" is an assumed chance
mechanism (for example, "this coin lands heads with probability 0.5").
To decide if data is consistent with a model, assume the model is true,
simulate the data-generating process many times, build the simulated
distribution, and see how often the model produces a result as extreme
as the one observed. Remember: a surprising result is EVIDENCE to
question a model, never proof the model is false; and an ordinary result
never proves a model true.
Fluency Practice
Apply the simulation framework: device, trial, statistic, repetitions, and reading distributions.
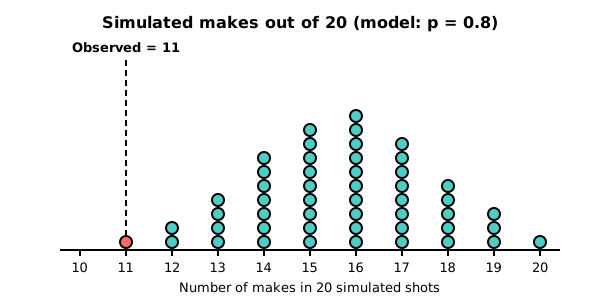
The dot plot below is a simulated distribution of the number of makes in 20 free throws under the model (50 simulated sessions). The shooter's actual session, 11 makes out of 20, is marked with the red dot far in the lower tail. Describe where the center of the distribution is, and explain in one sentence whether 11 makes looks typical or surprising under this model.