Back to Graph linear inequalities — Problem 3 · Task Set 54
Exercises: Graph Linear Inequalities and Systems
For each graphing problem, state: (1) whether the boundary is solid or dashed, (2) which test point you used, and (3) which half-plane is shaded. For systems, verify a point in the feasible region satisfies all inequalities.
Grade 9·18 problems·~40 min·Common Core Math - HS Algebra·standard·hsa-rei-d-12
Work through problems with immediate feedback
A
Recall / Warm-Up
1
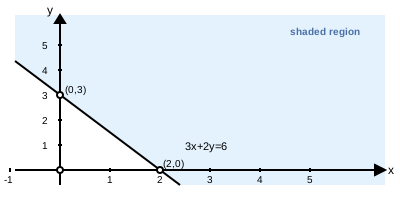
A graph shows a solid line through and with the region above and to the left shaded.
Which inequality does this graph represent?