Exercises: Graph Linear Inequalities and Systems
For each graphing problem, state: (1) whether the boundary is solid or dashed, (2) which test point you used, and (3) which half-plane is shaded. For systems, verify a point in the feasible region satisfies all inequalities.
Recall / Warm-Up
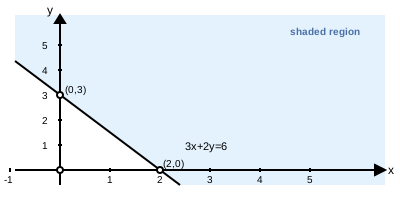
To determine which half-plane to shade for , a student substitutes :
. True.
What does this tell the student?
Fluency Practice
Graph using the test-point method. State: (a) whether the boundary is solid or dashed, (b) which test point you chose and what happens when you substitute it, and (c) which side to shade.
Graph and describe the solution set.
Note: the line passes through the origin. Which test point should you use, and why?
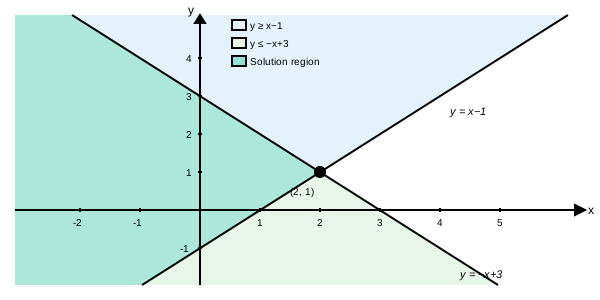
Describe how to graph the system and , and find the solution region.
(a) Describe the boundary lines and which half-plane each inequality shades.
(b) Verify that is in the solution region by checking both inequalities.
You're viewing 2 of 6 sections.
Create a free account to continue the full exercise set and save your progress.
Create free accountAnswer all problems to submit.