Exercises: Compute and Interpret the Correlation Coefficient
Work through each section in order. The correlation coefficient r measures
the STRENGTH and DIRECTION of a LINEAR association on a scale from -1 to +1.
Read its SIGN for direction and its MAGNITUDE (distance from 0) for strength.
Where a problem gives a calculator or spreadsheet value, use it as your
computed r. Remember: r sees only straight-line patterns, an outlier can
swing it, and a high r never proves causation.
Warm-Up: Reading the Correlation Scale
These problems review how to read a given r value.
The correlation coefficient measures two things about a linear association. Which pair does it report?
The direction (from its sign) and the strength (from its magnitude) of a linear association.
The mean and the standard deviation of the data.
The slope and the y-intercept of the regression line.
The number of data points and the units of measurement.
A data set has correlation coefficient . Which statement best describes this association?
A very strong negative linear association.
A weak association, because is negative.
A weak positive association.
No linear association at all.
A regression line has slope (dollars per hour) and the fit has correlation coefficient . A student says "the correlation is 12." What is the correct value and meaning of here?
The correlation is , a unitless measure of fit strength on to ; the slope is a separate rate with units.
The correlation is , the same as the slope.
The correlation is dollars per hour.
The correlation is dollars per hour.
On the correlation scale, match the endpoints and middle. Which row is correct?
: perfect positive (points on an upward line); : perfect negative (points on a downward line); : no linear association.
: no association; : perfect fit; : weak fit.
: strongest; : weakest; : moderate.
: perfect downward line; : scatter; : scatter.
Fluency Practice
Estimate r from each plot, or read and interpret a given r value.
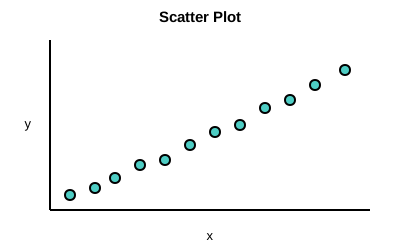
The scatter plot below shows points that lie in a tight upward band, hugging a rising line closely. Which value of best matches this plot?
Two relationships are summarized: relationship P has and relationship Q has . Which relationship has the STRONGER linear association, and how do their plots compare?
Q is stronger; its points hug the line tightly, while P is a noticeably looser cloud.
P is stronger, because means "half" the points fit perfectly.
They are equally strong, since both values are positive.
P is stronger, because a smaller means less scatter.
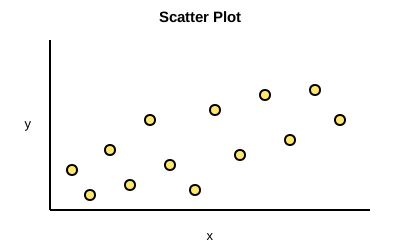
The scatter plot below shows points that drift upward overall but spread out in a loose cloud around the trend. Which value of best matches this plot, and is the association strong or moderate?
— a moderate (loose) positive association.
— a strong (tight) positive association.
— a strong positive association, since is large.
— a moderate negative association.
A student enters bivariate data into a graphing calculator and runs LinReg with diagnostics on. The output reports and slope . To one decimal place, what is the value of the correlation coefficient ?
In a spreadsheet, a student selects two data columns and enters CORREL(A2:A20, B2:B20). The cell displays . To two decimal places, what is the correlation coefficient for this data?
You're viewing 2 of 6 sections.
Create a free account to continue the full exercise set and save your progress.
Create free account