Back to Compute and interpret the correlation coefficient — Problem 3 · Task Set 10
Exercises: Compute and Interpret the Correlation Coefficient
Work through each section in order. The correlation coefficient r measures
the STRENGTH and DIRECTION of a LINEAR association on a scale from -1 to +1.
Read its SIGN for direction and its MAGNITUDE (distance from 0) for strength.
Where a problem gives a calculator or spreadsheet value, use it as your
computed r. Remember: r sees only straight-line patterns, an outlier can
swing it, and a high r never proves causation.
Grade 10·21 problems·~30 min·Common Core Math - HS Statistics and Probability·group·hss-id-c-8
Work through problems with immediate feedback
A
Fluency Practice
Estimate r from each plot, or read and interpret a given r value.
1
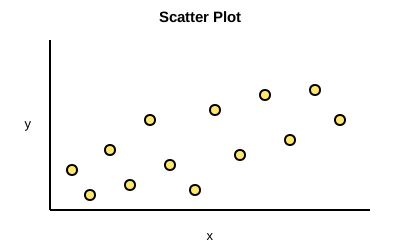
The scatter plot below shows points that drift upward overall but spread out in a loose cloud around the trend. Which value of best matches this plot, and is the association strong or moderate?