Exercises: Fitting a Linear Function to a Scatter Plot
Work through each section in order. When a scatter plot is shown, first
decide whether it suggests a LINEAR association before fitting a line. To
find a line's equation, read two convenient points ON the line (not
necessarily data points), compute slope as rise over run, and find the
y-intercept. Remember: a line of fit balances points above and below and
need not pass through any data point.
Warm-Up: Slope, Lines, and Form
These problems review slope and line basics you already know.
Before fitting a line to a scatter plot, what must you first confirm about the data?
That the scatter plot suggests a linear (straight-line) association.
That every data point lies exactly on one straight line.
That there are an even number of data points.
Nothing — a line of best fit can always be drawn for any data.
A line passes through the points and . What is the slope of this line?
A fitted line has equation . Use it to predict when .
Fluency Practice
Read scatter plots, judge form, and find or use line equations.
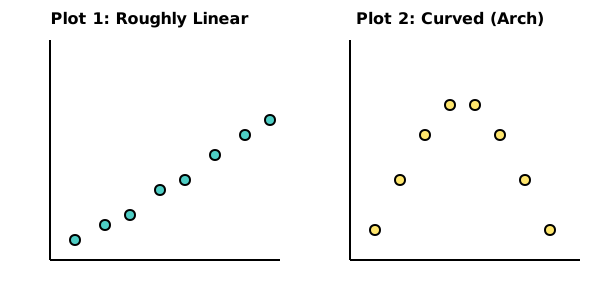
Two scatter plots are shown. Plot 1 shows points rising in a roughly straight band; Plot 2 shows points rising then falling in a clear arch. For which plot is fitting a linear function appropriate?
Plot 1 only, because its points suggest a linear association.
Plot 2 only, because its curve is more interesting.
Both plots, since a line of best fit always exists.
Neither plot, since the points do not lie exactly on a line.
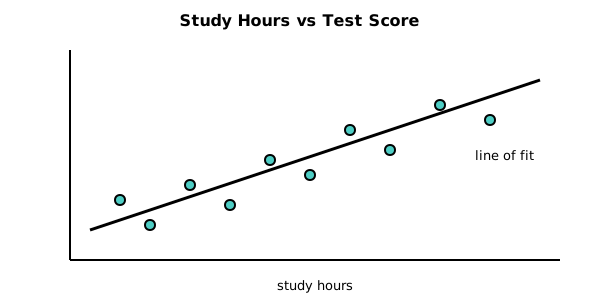
A scatter plot of study hours versus test score is shown with a line drawn through the cloud. The line passes through none of the plotted data points, yet roughly as many points sit above it as below. Is this a reasonable line of fit?
Yes. A good line of fit balances points above and below and need not touch any data point.
No. A line of fit must pass through at least two of the data points.
No. A line of fit must pass through every data point to be valid.
No. The line is wrong because it misses all the points.
A drawn line of fit passes through the points and . What is the slope of this line?
The same line of fit passes through and , giving slope . What is the -intercept in the equation ?
A student eyeballs a line of fit as . Their calculator's least-squares regression line is . Is the student's hand-drawn line wrong?
No. A reasonable eyeballed line is close to the regression line but not identical; small differences are expected.
Yes. The hand-drawn line must match the regression line exactly or it is wrong.
Yes. The regression line is wrong because it disagrees with the student.
It is impossible to tell without re-plotting every point.
You're viewing 2 of 6 sections.
Create a free account to continue the full exercise set and save your progress.
Create free account