Exercises: Fitting Data to a Normal Distribution
Work through each section in order. For empirical-rule problems, use the
68-95-99.7 percentages and the curve's symmetry. For z-score problems, first
standardize with , then look up the
area with a calculator, spreadsheet, or table. Round percentages as directed.
Remember: the empirical rule and z-scores apply ONLY to roughly normal data.
Warm-Up: The Normal Curve
These problems review the shape and vocabulary of the normal model.
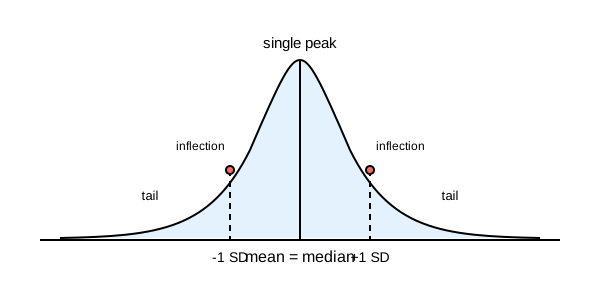
The diagram shows a normal (bell) curve. Which statement correctly describes its features?
It is symmetric about the mean, has a single peak at the mean (which equals the median), and its tails approach but never touch the axis.
It is symmetric, but the peak sits at the median, which is different from the mean.
It has two equal peaks, one on each side of the mean.
Its tails eventually reach and touch the horizontal axis.
A student says, "All real-world data is normal, because real data is normal/ordinary." Which response is correct?
"Normal" here is a technical name for one specific bell shape; many real data sets (incomes, wait times, mixed-group measurements) are NOT normal, so you must check the shape first.
The student is right — every real data set follows a bell curve.
Only made-up data is normal; real data never is.
"Normal" just means the data has a mean and a standard deviation, which all data does.
Adult female heights are approximately normal with mean inches and standard deviation inches. The interval "within one standard deviation of the mean" runs from inches up to what upper height, in inches?
Fluency Practice
Use the empirical rule and z-scores. Test scores below are normal with mean 500, SD 100.
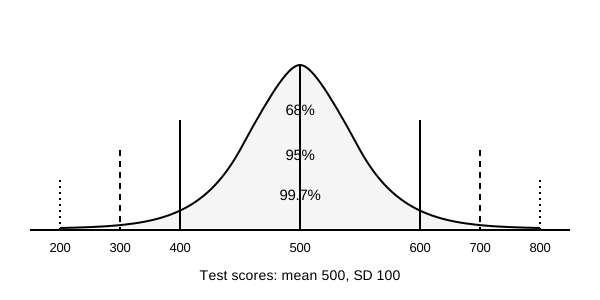
Test scores are normally distributed with mean and standard deviation . The diagram shows the empirical-rule bands. About what percentage of scores fall between and (within one standard deviation of the mean)? Enter a number (percent).
Test scores are normal with mean , SD . Using the empirical rule, about what percentage of scores are ABOVE ? Use the symmetry of the curve. Enter a number (percent).
Test scores are normal with mean , SD . About what percentage of scores fall between and (within two standard deviations)? Enter a number (percent).
Test scores are normal with mean , SD . Compute the z-score for a score of . Enter the z-score (it may be negative).
Test scores are normal with mean , SD . For a score of , the z-score is . Using a calculator, spreadsheet, or table, the area BELOW is about . About what percentage of scores are ABOVE ? Round to the nearest tenth of a percent.
You're viewing 2 of 6 sections.
Create a free account to continue the full exercise set and save your progress.
Create free account