Back to Represent data with plots — Problem 5 · Task Set 1
Exercises: Represent Data with Plots on the Real Number Line
Work through each section in order. For plots, read carefully: dot plots
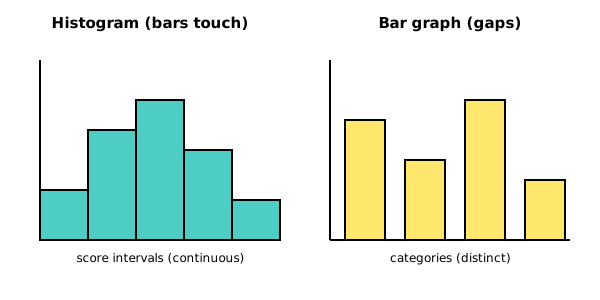
show every individual value, histograms group values into intervals (bars
touch), and box plots summarize data with the five-number summary
(minimum, Q1, median, Q3, maximum). Write explanation answers in complete
sentences.
Grade 9·22 problems·~35 min·Common Core Math - HS Statistics and Probability·group·hss-id-a-1
Work through problems with immediate feedback
A
Fluency Practice
Read each plot and answer. Use the displayed values.
1
The figure below shows two displays side by side. Which statement correctly distinguishes a histogram from a bar graph?