Exercises: Describe Qualitatively the Functional Relationship Between Two Quantities by Analyzing a Graph
Work through each section in order. For these problems, you describe and sketch graphs using words like increasing, decreasing, constant, linear, and nonlinear. You do not need exact numbers — focus on direction, shape, and relative steepness.
Recall / Warm-Up
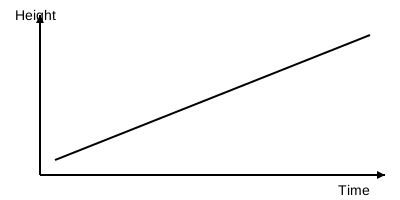
Fluency Practice
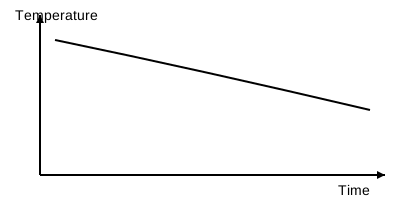
The graph shows the temperature of a room during one evening. Which statement best describes the whole graph?
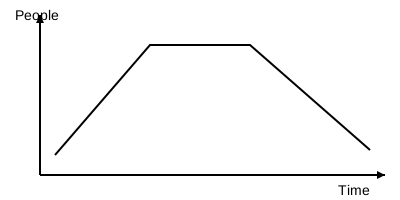
The graph shows the number of people in a store over one day. How many separate behaviors (increasing, decreasing, or constant sections) does it have?
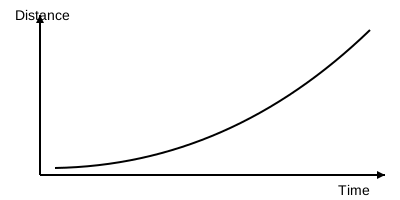
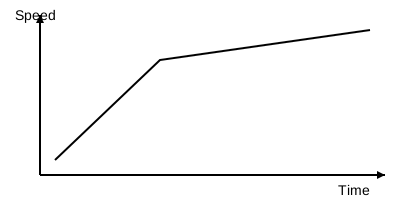
This graph shows the speed of a car over time. A student points to the steepest section and says, 'The car is moving fastest here.' Is that correct?
You're viewing 2 of 6 sections.
Create a free account to continue the full exercise set and save your progress.
Create free accountAnswer all problems to submit.