Back to Describe qualitatively the functional relationship between two quantities by analyzing a graph — Problem 1 · Task Set 18
Exercises: Describe Qualitatively the Functional Relationship Between Two Quantities by Analyzing a Graph
Work through each section in order. For these problems, you describe and sketch graphs using words like increasing, decreasing, constant, linear, and nonlinear. You do not need exact numbers — focus on direction, shape, and relative steepness.
Grade 8·21 problems·~30 min·Common Core Math - Grade 8·container·8-f-b-5
Work through problems with immediate feedback
A
Fluency Practice
1.
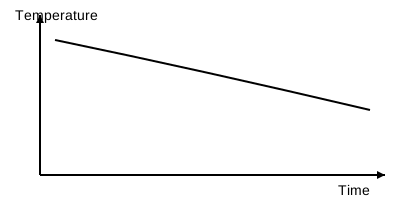
The graph shows the temperature of a room during one evening. Which statement best describes the whole graph?