Exercises: Dot Plots, Histograms, and Box Plots
Show your work for each construction. Label all axes with variable names and units.
Warm-Up: Review What You Know
These problems review skills you need for constructing displays.
A dot plot places each data value as a dot on a number line. If four students scored 85 on a test, how many dots appear at 85 on the dot plot?
A histogram shows data grouped into intervals. The interval 20–30 has a bar of height 5. What does this mean?
Fluency Practice
Construct or analyze each type of data display.
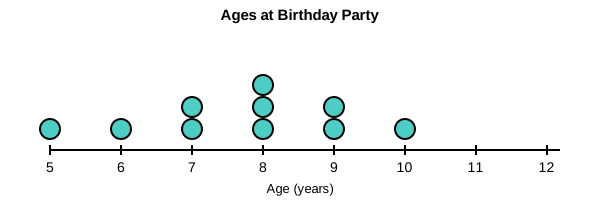
A dot plot shows ages of 10 children at a birthday party. Use the dot plot to answer: What is the most common age (the value with the most dots)?
Construct a dot plot for this data set: {12, 14, 12, 15, 14, 12, 16}. Listing each distinct value once in increasing order with its dot count: value 12 gets ̲ ̲ ̲ ̲ ̲ ̲ ̲ ̲ ̲ ̲ ̲ ̲ ̲ ̲ ̲ ̲ ̲ ̲ ̲ ̲ ̲ ̲ dots, value 14 gets ̲ ̲ ̲ ̲ ̲ ̲ ̲ ̲ ̲ ̲ ̲ ̲ ̲ ̲ ̲ ̲ ̲ ̲ ̲ ̲ ̲ ̲ dots, value 15 gets ̲ ̲ ̲ ̲ ̲ ̲ ̲ ̲ ̲ ̲ ̲ ̲ ̲ ̲ ̲ ̲ ̲ ̲ ̲ ̲ ̲ ̲ dots, value 16 gets ̲ ̲ ̲ ̲ ̲ ̲ ̲ ̲ ̲ ̲ ̲ ̲ ̲ ̲ ̲ ̲ ̲ ̲ ̲ ̲ ̲ ̲ dots.
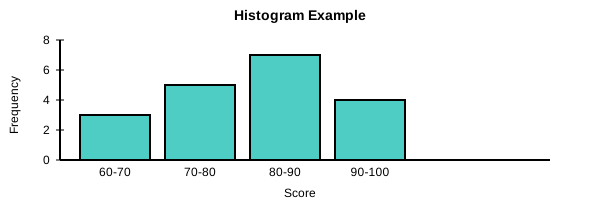
A histogram shows quiz scores in intervals of width 10: [60,70) has 2 students, [70,80) has 6 students, [80,90) has 8 students, [90,100] has 4 students. How many students took the quiz in total?
Find the median of this sorted data set of 11 values: {42, 45, 50, 55, 60, 65, 68, 72, 75, 80, 90}.
Sorted data: {42, 45, 50, 55, 60, 65, 68, 72, 75, 80, 90}. The median is 65. The lower half (excluding median) is {42, 45, 50, 55, 60}. Q1 = ̲ ̲ ̲ ̲ ̲ ̲ ̲ ̲ ̲ ̲ ̲ ̲ ̲ ̲ ̲ ̲ ̲ ̲ ̲ ̲ ̲ ̲ . The upper half (excluding median) is {68, 72, 75, 80, 90}. Q3 = ̲ ̲ ̲ ̲ ̲ ̲ ̲ ̲ ̲ ̲ ̲ ̲ ̲ ̲ ̲ ̲ ̲ ̲ ̲ ̲ ̲ ̲ . IQR = Q3 − Q1 = ̲ ̲ ̲ ̲ ̲ ̲ ̲ ̲ ̲ ̲ ̲ ̲ ̲ ̲ ̲ ̲ ̲ ̲ ̲ ̲ ̲ ̲ .
You're viewing 2 of 6 sections.
Create a free account to continue the full exercise set and save your progress.
Create free accountAnswer all problems to submit.