Back to Display numerical data in plots on a number line — Problem 1 · Task Set 28
Exercises: Dot Plots, Histograms, and Box Plots
Show your work for each construction. Label all axes with variable names and units.
Grade 6·23 problems·~37 min·Common Core Math - Grade 6·standard·6-sp-b-4
Work through problems with immediate feedback
A
Fluency Practice
Construct or analyze each type of data display.
1.
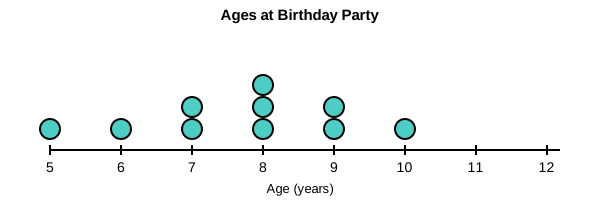
A dot plot shows ages of 10 children at a birthday party. Use the dot plot to answer: What is the most common age (the value with the most dots)?