Back to Exercise: Understand that a set of data has a distribution

Exercises: Distributions -- Center, Spread, and Shape

Use the vocabulary: center, spread, and shape to describe data distributions.

Grade 6·17 problems·~20 min·Common Core Math - Grade 6·standard·6-sp-a-2
Work through problems with immediate feedback
A

Warm-Up: Review What You Know

These problems review key vocabulary.

1

A statistical question generates data. What does that data describe?

2

A dot plot shows scores of 5 students: 70, 75, 75, 80, 80. How many students scored 75?

B

Reading Distributions

Use each display to describe the distribution.
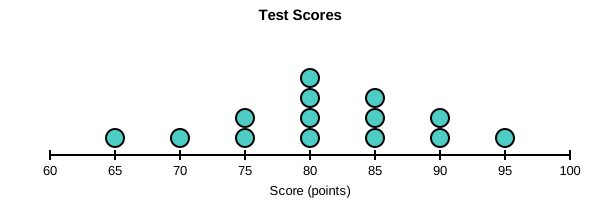
Dot plot of test scores on a number line from 60 to 100. Dot counts by score: 65 has 1, 70 has 1, 75 has 2, 80 has 4, 85 has 3, 90 has 2, 95 has 1.
1

Where do most values in the dot plot cluster?

Dot plot of test scores on a number line from 60 to 100. Dot counts by score: 65 has 1, 70 has 1, 75 has 2, 80 has 4, 85 has 3, 90 has 2, 95 has 1.
2

Use the dot plot of test scores below (values from 65 to 95). Which statement correctly describes the spread?

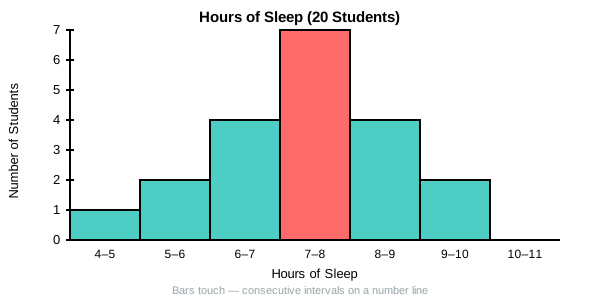
Histogram of sleep hours for 20 students, intervals 4-5 through 10-11 hours. Bar heights left to right: 1, 2, 4, 7, 4, 2, 0 students.
3

A histogram shows hours of sleep for 20 students. Describe the center, spread, and shape of this distribution in 2–3 sentences.

You're viewing 2 of 6 sections.

Create a free account to continue the full exercise set and save your progress.

Create free account
0 of 5 answered

Answer all problems to submit.

Was this practice set helpful?
Report a problem with this page