Exercises: Comparing Center and Spread of Data Sets
Work through each section in order. Report center and spread as matched
pairs: mean travels with standard deviation (SD), median travels with the
interquartile range (IQR). Choose the pair by the SHAPE of the data first:
roughly symmetric uses mean/SD; skewed or outlier-laden uses median/IQR. A
complete comparison of two or more sets states a center finding AND a spread
finding. Round SD to two decimal places unless told otherwise.
Warm-Up: Mean, Median, and the Five-Number Summary
These problems review computations you already know from HSS.ID.A.1.
Fluency Practice
Compute each statistic. Keep mean with SD and median with IQR.
Compute the standard deviation of (mean ). Use the population formula (divide the sum of squared deviations by ). Round to two decimal places.
A second set is . Its mean is also . Without the long computation, which set is MORE spread out: this one or ? Then state the larger standard deviation rounded to two decimals (it is for one set and for the other). Enter only the larger SD.
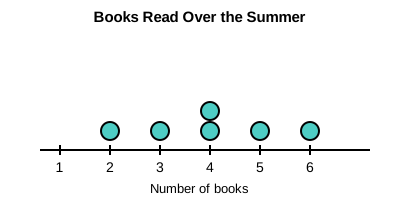
The dot plot below shows the number of books students read over the summer. Describe the shape (roughly symmetric, or skewed/outlier-laden), then name the matched pair of statistics — center and spread — you would report for this data.
You're viewing 2 of 6 sections.
Create a free account to continue the full exercise set and save your progress.
Create free accountAnswer all problems to submit.