Back to Compare center and spread of data sets — Problem 4 · Task Set 2
Exercises: Comparing Center and Spread of Data Sets
Work through each section in order. Report center and spread as matched
pairs: mean travels with standard deviation (SD), median travels with the
interquartile range (IQR). Choose the pair by the SHAPE of the data first:
roughly symmetric uses mean/SD; skewed or outlier-laden uses median/IQR. A
complete comparison of two or more sets states a center finding AND a spread
finding. Round SD to two decimal places unless told otherwise.
Grade 9·21 problems·~35 min·Common Core Math - HS Statistics and Probability·group·hss-id-a-2
Work through problems with immediate feedback
A
Fluency Practice
Compute each statistic. Keep mean with SD and median with IQR.
1
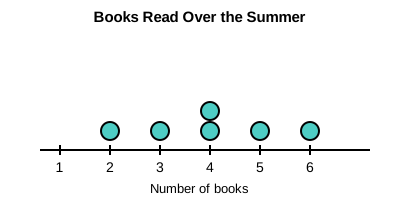
The dot plot below shows the number of books students read over the summer. Describe the shape (roughly symmetric, or skewed/outlier-laden), then name the matched pair of statistics — center and spread — you would report for this data.