8.SP Tutor Intake -- Patterns of Association in Bivariate Data
This short check helps your tutor understand where to start. Answer each
question on your own, without help. If you're not sure, give your best
try — the goal is to find what to work on together, not to grade you.
Concepts
A scatter plot displays two numerical measurements taken on each
individual. For which pair of variables would a two-way frequency
table — NOT a scatter plot — be the appropriate tool to investigate
a pattern of association?
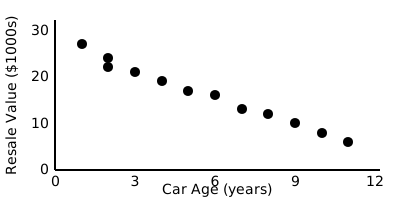
The scatter plot below shows data collected on a group of used cars:
each point is one car's age (horizontal axis) and its resale value
(vertical axis). Which phrase best describes the overall pattern of
association? Use the grade-8 language of association.
Procedures
A survey of 40 students recorded whether each has a curfew and
whether each has assigned chores. The two-way table below summarizes
the results.
| Chores | No Chores | Total | |
|---|---|---|---|
| Curfew | 16 | 4 | 20 |
| No Curfew | 8 | 12 | 20 |
| Total | 24 | 16 | 40 |
The value 16 in the "Curfew / Chores" cell is which kind of frequency?
A line of best fit has been drawn on a scatter plot of hours of daily
sunlight (x) versus plant height in centimeters (y). The line passes
through the points (3, 15) and (9, 24). What is the slope of this
line? Enter a number (centimeters per hour).
A scatter plot shows a positive linear association between two
variables. Four students each draw a different straight line through
the data. Which line is the best informal line of fit?
The linear model for plant height is y = 1.5x + 10.5, where x is hours
of daily sunlight and y is plant height in centimeters. The data used
to build the model ranged from 3 to 10 hours of sunlight. Use the model
to predict the plant height (in cm) for a plant that receives 6 hours
of daily sunlight. Enter a number.
The two-way table below summarizes a survey of 30 students on whether
they eat breakfast and whether they feel tired by noon.
| Tired | Not Tired | Total | |
|---|---|---|---|
| Breakfast | 5 | 13 | 18 |
| No Breakfast | 9 | 3 | 12 |
| Total | 14 | 16 | 30 |
Among the students who eat breakfast, what fraction feel tired by
noon? Give your answer as a row relative frequency (you may enter a
fraction, decimal, or percent).
You're viewing 2 of 3 sections.
Create a free account to continue the full exercise set and save your progress.
Create free accountAnswer all problems to submit.