Back to Statistics and Probability — Problem 2 · Task Set 38
8.SP Tutor Intake — Patterns of Association in Bivariate Data
This short check helps your tutor understand where to start. Answer each
question on your own, without help. If you're not sure, give your best
try — the goal is to find what to work on together, not to grade you.
Grade 8·12 problems·~13 min·Common Core Math - Grade 8·domain·sp
Work through problems with immediate feedback
A
Concepts
1.
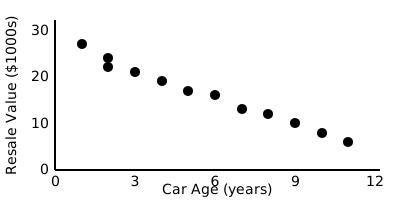
The scatter plot below shows data collected on a group of used cars:
each point is one car's age (horizontal axis) and its resale value
(vertical axis). Which phrase best describes the overall pattern of
association? Use the grade-8 language of association.