Back to Know that straight lines are widely used to model relationships between two quantitative variables — Problem 1 · Task Set 31
Exercises: Fitting and Assessing Lines on Scatter Plots
Work through each section in order. When you look at a scatter plot, judge the whole cloud of points, not one point at a time. A fitted line should follow the trend and have roughly equal numbers of points above and below it. Remember that a fitted line is a model - a useful summary, not the exact data - and that several reasonable lines may fit the same data.
Grade 8·21 problems·~35 min·Common Core Math - Grade 8·container·8-sp-a-2
Work through problems with immediate feedback
A
Fluency Practice
1.
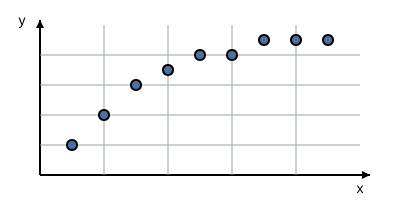
A scatter plot is shown. Is a straight line an appropriate model for this data?