Exercises: Fitting and Assessing Lines on Scatter Plots
Work through each section in order. When you look at a scatter plot, judge the whole cloud of points, not one point at a time. A fitted line should follow the trend and have roughly equal numbers of points above and below it. Remember that a fitted line is a model - a useful summary, not the exact data - and that several reasonable lines may fit the same data.
Recall / Warm-Up
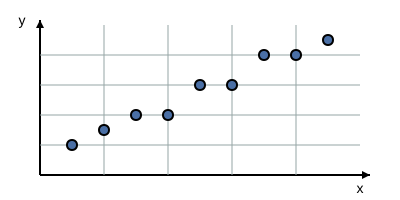
A scatter plot shows a clear upward linear trend. Why might we draw a single straight line through the cloud of points?
Fluency Practice
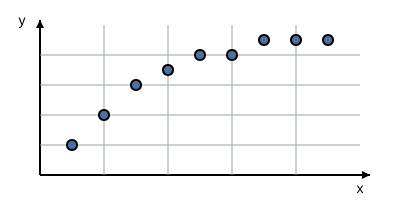
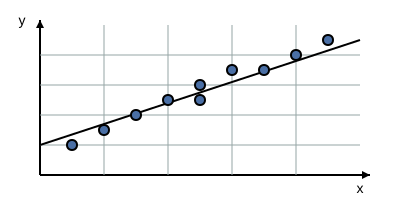
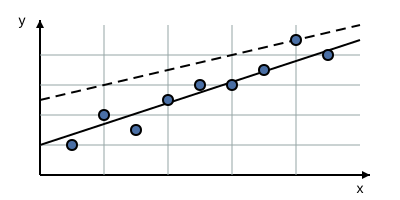
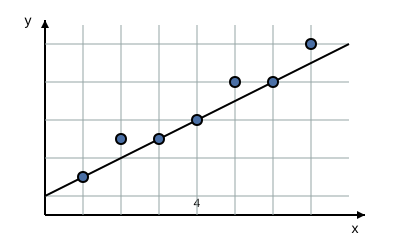
A line has been drawn through a scatter plot. Using the criteria for a good informal fit, how well does this line fit the data?
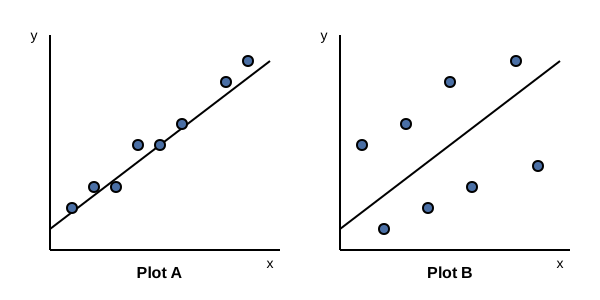
Two scatter plots each have a fitted line drawn through them. In which plot is the line a better fit?
Complete the sentence about assessing fit. When the data points cluster tightly around the fitted line, the fit is ̲ ̲ ̲ ̲ ̲ ̲ ̲ ̲ ̲ ̲ ̲ ̲ ̲ ̲ ̲ ̲ ̲ ̲ ̲ ̲ ̲ ̲ . When the points are widely scattered far from the line, the fit is ̲ ̲ ̲ ̲ ̲ ̲ ̲ ̲ ̲ ̲ ̲ ̲ ̲ ̲ ̲ ̲ ̲ ̲ ̲ ̲ ̲ ̲ .
You're viewing 2 of 6 sections.
Create a free account to continue the full exercise set and save your progress.
Create free accountAnswer all problems to submit.