Back to Understand that a set of data has a distribution — Problem 2 · Task Set 26
Exercises: Distributions — Center, Spread, and Shape
Use the vocabulary: center, spread, and shape to describe data distributions.
Grade 6·17 problems·~20 min·Common Core Math - Grade 6·standard·6-sp-a-2
Work through problems with immediate feedback
A
Reading Distributions
Use each display to describe the distribution.
1.
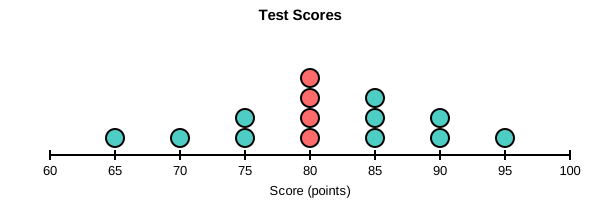
Use the dot plot of test scores below (values from 65 to 95). Which statement correctly describes the spread?