Back to Exercise: Understand that a set of data has a distribution

Exercises: Distributions — Center, Spread, and Shape

Use the vocabulary: center, spread, and shape to describe data distributions.

Grade 6·17 problems·~20 min·Common Core Math - Grade 6·standard·6-sp-a-2
Work through problems with immediate feedback
A

Warm-Up: Review What You Know

These problems review key vocabulary.

1.

A statistical question generates data. What does that data describe?

2.

A dot plot shows scores of 5 students: 70, 75, 75, 80, 80. What is the range of these scores?

B

Reading Distributions

Use each display to describe the distribution.
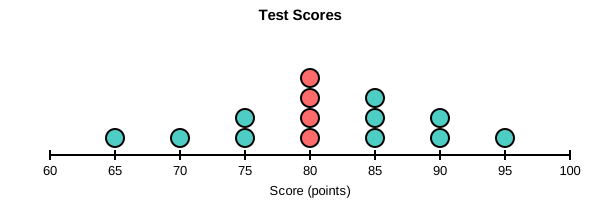
Dot plot of test scores from 65 to 95. Dots stack highest at 80 with 4 dots. The distribution is roughly symmetric around 80.
1.

Where do most values in the dot plot cluster?

Dot plot of test scores from 65 to 95. Dots stack highest at 80 with 4 dots. The distribution is roughly symmetric around 80.
2.

Use the dot plot of test scores below (values from 65 to 95). Which statement correctly describes the spread?

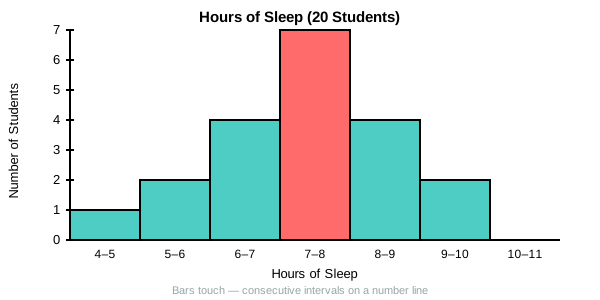
Histogram of sleep hours for 20 students. The tallest bar is at 7-8 hours. The distribution is roughly symmetric and bell-shaped, centered around 7-8 hours.
3.

A histogram shows hours of sleep for 20 students. Describe the center, spread, and shape of this distribution in 2–3 sentences.

You're viewing 2 of 6 sections.

Create a free account to continue the full exercise set and save your progress.

Create free account
0 of 5 answered

Answer all problems to submit.