Back to Fit data to a normal distribution — Problem 1 · Task Set 4
Exercises: Fitting Data to a Normal Distribution
Work through each section in order. For empirical-rule problems, use the
68-95-99.7 percentages and the curve's symmetry. For z-score problems, first
standardize with , then look up the
area with a calculator, spreadsheet, or table. Round percentages as directed.
Remember: the empirical rule and z-scores apply ONLY to roughly normal data.
Grade 10·21 problems·~35 min·Common Core Math - HS Statistics and Probability·group·hss-id-a-4
Work through problems with immediate feedback
A
Fluency Practice
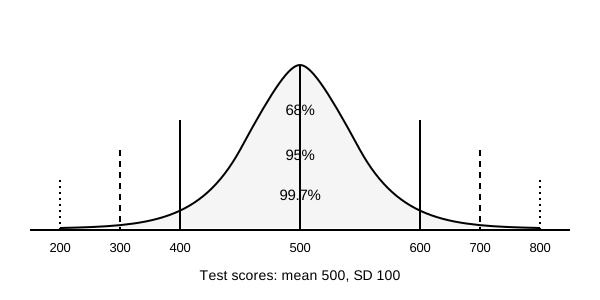
Use the empirical rule and z-scores. Test scores below are normal with mean 500, SD 100.
1
Test scores are normally distributed with mean and standard deviation . The diagram shows the empirical-rule bands. About what percentage of scores fall between and (within one standard deviation of the mean)? Enter a number (percent).