Exercises: Interpret Shape, Center, and Spread in Context
Work through each section in order. For interpretation problems, write in
complete sentences about the real-world quantity, not just numbers. Remember:
skew points toward the TAIL, the median and IQR resist outliers while the mean
and standard deviation do not, and "lower" or "higher" is good or bad only
relative to what is being measured.
Warm-Up: Describing and Comparing Distributions
These problems review description vocabulary you already know.
A student is asked to describe the distribution of daily commute times for 40 workers. Which response is a complete description of the distribution?
A histogram of household incomes has most values bunched on the left with a long tail stretching toward the high incomes on the right. How is this distribution described?
A data set has nine values clustered near 50 and one extreme value of 500. Adding the extreme value strongly changes one center but barely changes the other. Which center changes a lot: the ̲ ̲ ̲ ̲ ̲ ̲ ̲ ̲ ̲ ̲ ̲ ̲ ̲ ̲ ̲ ̲ ̲ ̲ ̲ ̲ ̲ ̲ ? Which center barely changes: the ̲ ̲ ̲ ̲ ̲ ̲ ̲ ̲ ̲ ̲ ̲ ̲ ̲ ̲ ̲ ̲ ̲ ̲ ̲ ̲ ̲ ̲ ? (Answer "mean" or "median" in each blank.)
Fluency Practice
Read each plot or summary and answer in context.
A distribution of test scores is roughly symmetric with one peak. Which center and which spread should you report to describe a typical score and its variability? (Answer "mean" or "median" for the center, and "standard deviation" or "IQR" for the spread.)
The waiting times at a clinic are right-skewed, with a long tail toward the very long waits. A report says "the distribution is left-skewed because most patients wait only a short time." What is wrong with this claim?
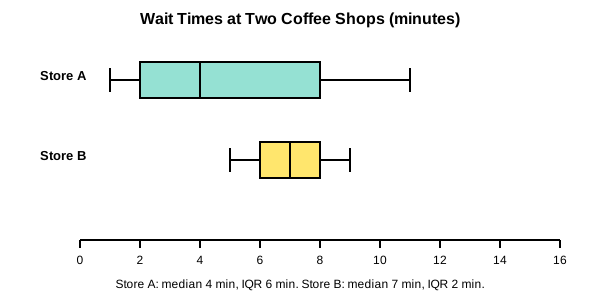
The box plots below show customer wait times at two coffee shops. Which statement correctly interprets BOTH the center and the spread difference?
Two classes take the same exam. Class X has a higher mean score than Class Y. A student concludes "a higher mean is always better, so Class X did better." On a DIFFERENT measure — the number of errors on a typing test — Class X also has the higher mean. What is the correct reasoning?
You're viewing 2 of 6 sections.
Create a free account to continue the full exercise set and save your progress.
Create free accountAnswer all problems to submit.