Back to Construct and interpret scatter plots for bivariate measurement data — Problem 3 · Task Set 30
Exercises: Reading and Building Scatter Plots
Work through each section in order. When you read a scatter plot, look at the whole cloud of points, not one point at a time. Use the words positive, negative, linear, nonlinear, cluster, and outlier to describe what you see.
Grade 8·23 problems·~35 min·Common Core Math - Grade 8·container·8-sp-a-1
Work through problems with immediate feedback
A
Recall / Warm-Up
1.
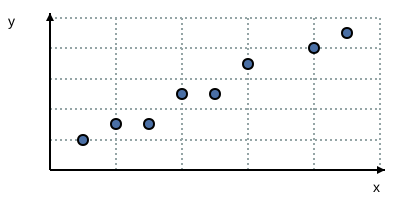
Look at the scatter plot. As you move from left to right, the cloud of points generally goes up. What direction is the trend?